About 2 years ago I made the first tests with Grafana using an ESP8266-01 module, Node-RED, Mosquitto (MQTT) and the InfluxDB database, by that time I did very basic tests which document in the following article: Tutorial ESP8266 Node-RED Granafa InfluxDB MQTT, in this opportunity I will try to explore more features since there is an official version that we will install in our Raspberry Pi 3 modelo B or Raspberry Pi 3 modelo B+.

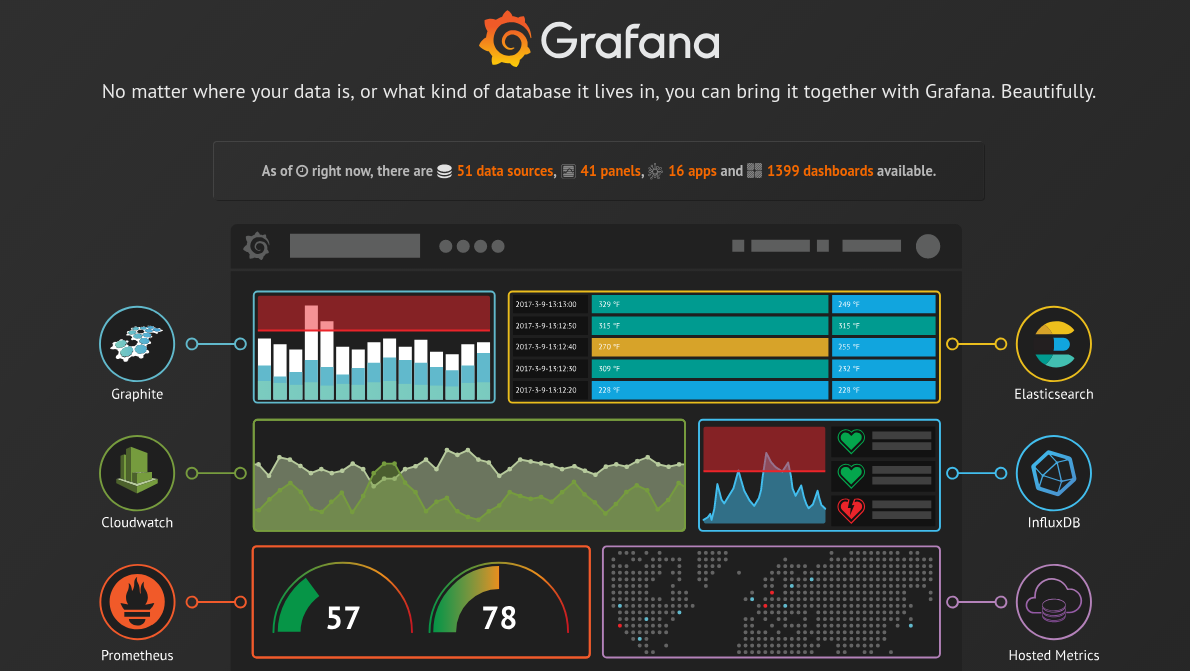
Grafana is a platform for analysis and visualization for those who do not know it, dashboards are very flashy and eye-catching, implemented mainly in monitoring servers, but can also adapt to the IoT field, it is open source of course with some restrictions, as I read in use of some additional supplements that are commercial, but in general it is (open source).
In few words Grafana is a great tool if you have especially historical databases and tables and require a tool to visualize, very dynamic from my point of view, allows connection with more than 50 databases among other characteristics that I will mention below
Note: As mentioned before verify that not all add-ons are free to use, some are commercial.
Official Web site : grafana.com
Video: Installation Dashboard Grafana in Raspberry Pi 3 B or B+
Materials y where to buy them
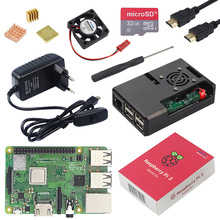
- 1 Raspberry Pi 3 Modelo B + Banggood
- 1 Raspberry Pi 3 Modelo B + Aliexpress
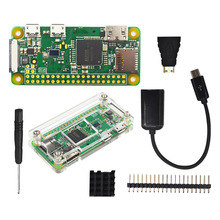
- 1 Raspberry Pi Zero (not tested yet)
- 8GB MicroSD Card with Raspbian Operating System Installed
- 1 Power supply 5v 2A – Banggood
Recommendations
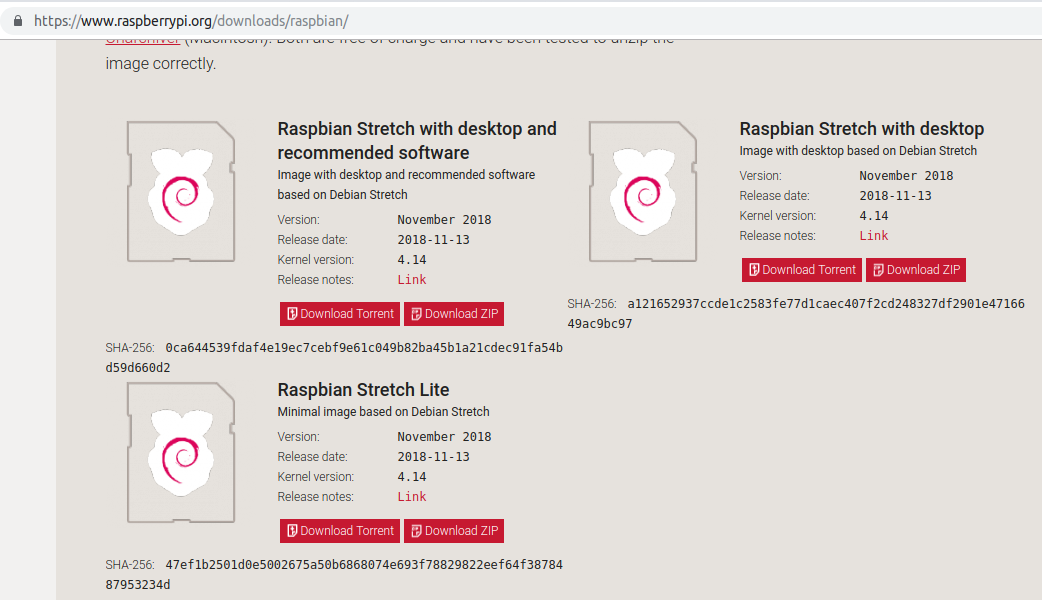
Raspbian Stretch Lite
To have the best performance of our Raspberry Pi, I recommend installing RASPBIAN STRETCH LITE, this version is the image has the minimum of pre-installed applications, no desktop or graphical interface, all configuration is done through command line, I recommend microSD 8GB .
SSH Client Installation and Raspbian OS
Since there are hundreds of tutorials on how to mount raspbian on the Internet, I will skip the step and leave this tutorial hackernoon.com site to which I thank for the tutorial, it indicates the process of mounting the operating system and additional mount the SSH client.
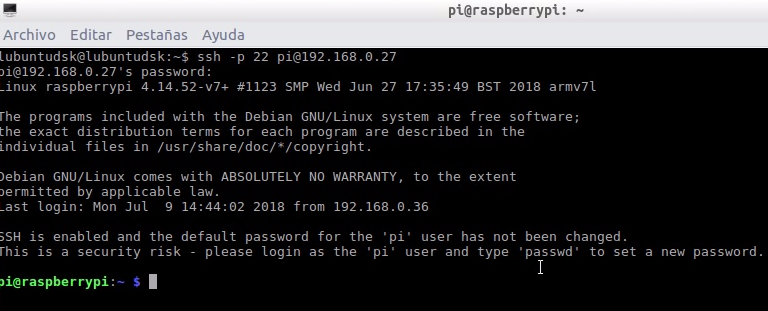
 Note: The raspberry pi 3 B and / or B + has Wifi included.
Grafana Installation
Verify commands in Grafana for ARM, in case there is a new version available..
Recommendation: For a more detailed explanation step by step I recommend watching the full video Installation Dashboard Grafana in Raspberry Pi 3 B or B +: PDAControl available on our Youtube channel PDAControl.
Update list of available packages
sudo apt update
Update list of available packages
sudo apt upgrade -y
Remove obsolete packages
sudo apt autoremove -y
download Grafana package
wget https://dl.grafana.com/oss/release/grafana_5.4.0_armhf.deb
Install Grafana package
sudo dpkg -i grafana_5.4.0_armhf.deb
Update packages
sudo apt-get upgrade
Fix a lack of missing packages
sudo apt --fix-broken install
Set up service
sudo /bin/systemctl daemon-reload
Enable Grafana service
sudo /bin/systemctl enable grafana-server
Grafana service starts
sudo /bin/systemctl start grafana-server
Ready installed and running.
Note: Grafana will automatically start when we start our Raspberry pi.
Installation complete
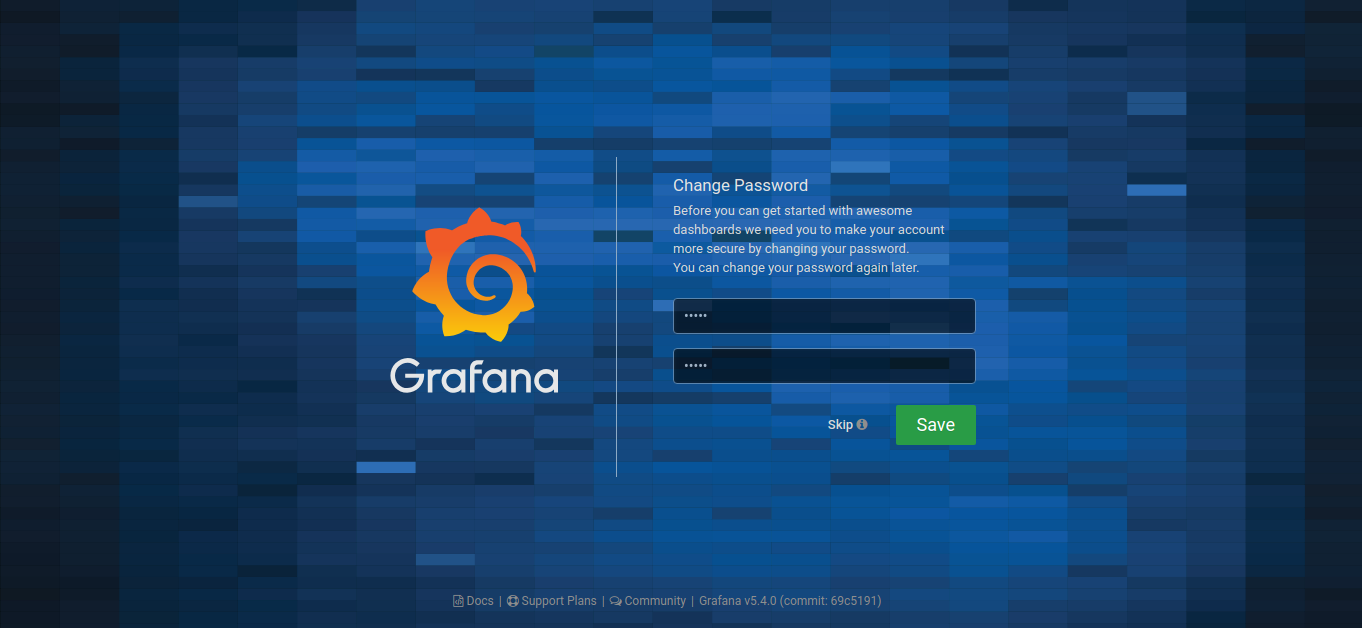
Enter from the web browser of your preference to the IP address of our Raspberry with port 3000. You should see a default authentication window, username and password ‘admin’ and ‘admin‘.
Recommendation: For a more detailed explanation step by step I recommend watching the full video Installation Dashboard Grafana in Raspberry Pi 3 B or B +: PDAControl available on our Youtube channel PDAControl.

- After registering you will be able to change the username and password.
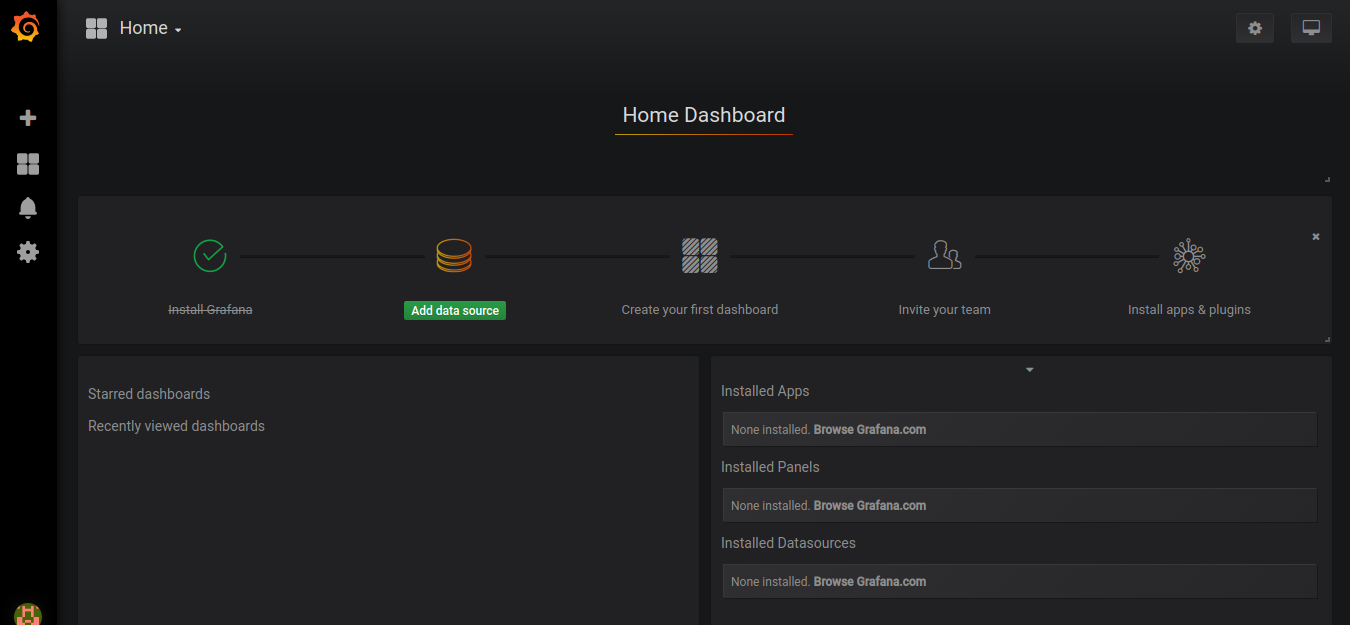
- The main page indicate the step by step to configure Grafana
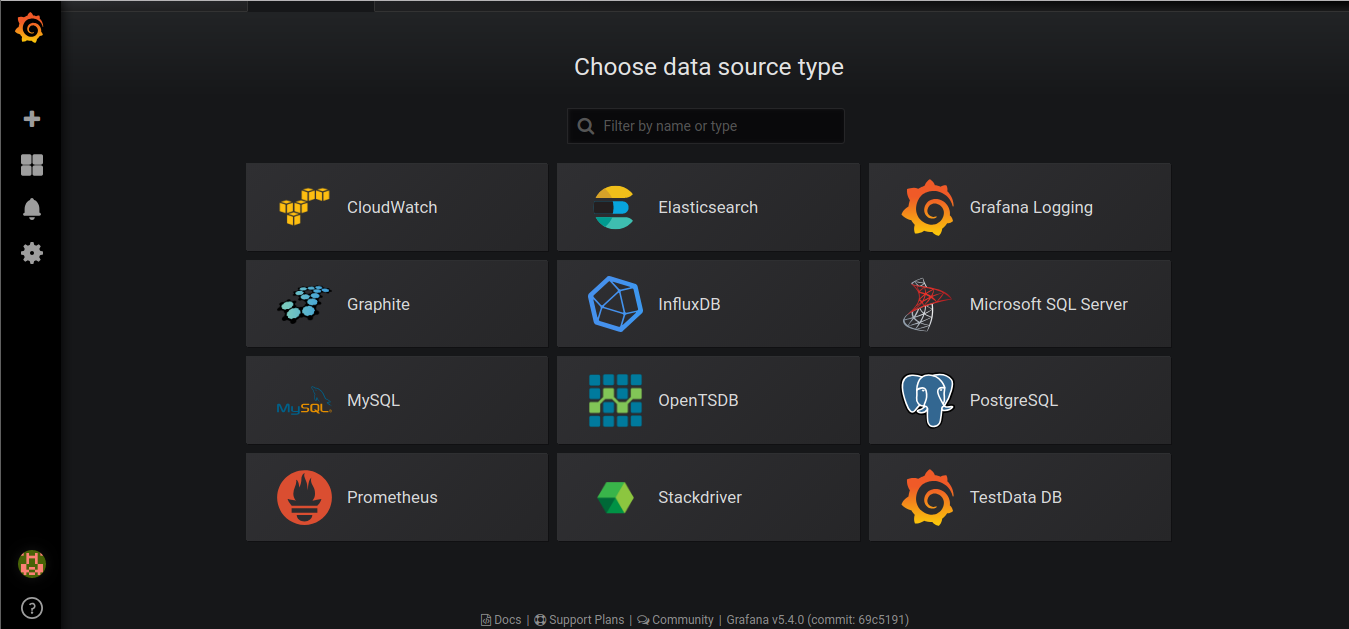
- Select the database from which data will be extracted.
Other Recommended Tutorials
http://pdacontrolen.com/instalacion-completa-base-de-datos-mysql-mariadb-en-raspberry-pi-3-b-b/
Meter PZEM-004T with Arduino ESP32 ESP8266 Python & Raspberry Pi
Conclusions
It is very gratifying that these open source initiatives exist, and the facility to install them, in my first tests 2 years ago was complicated, since there were no official versions for Raspberry Pi.
These are initial tests although I do basic tests with InfluxDB, this time I will give priority to tests with MySQL since it is a database of which I have more knowledge, but in future tutorials we will explore other databases.
Since we are installed an official version is also unlikely to find errors, even considering it is a Raspberry Pi.
Although I have not done tests on Raspberry Pi Zero, I guess it would work but not with the same performance as Raspberry Pi 3 Modelo B or Raspberry Pi 3 Modelo B+.
References

